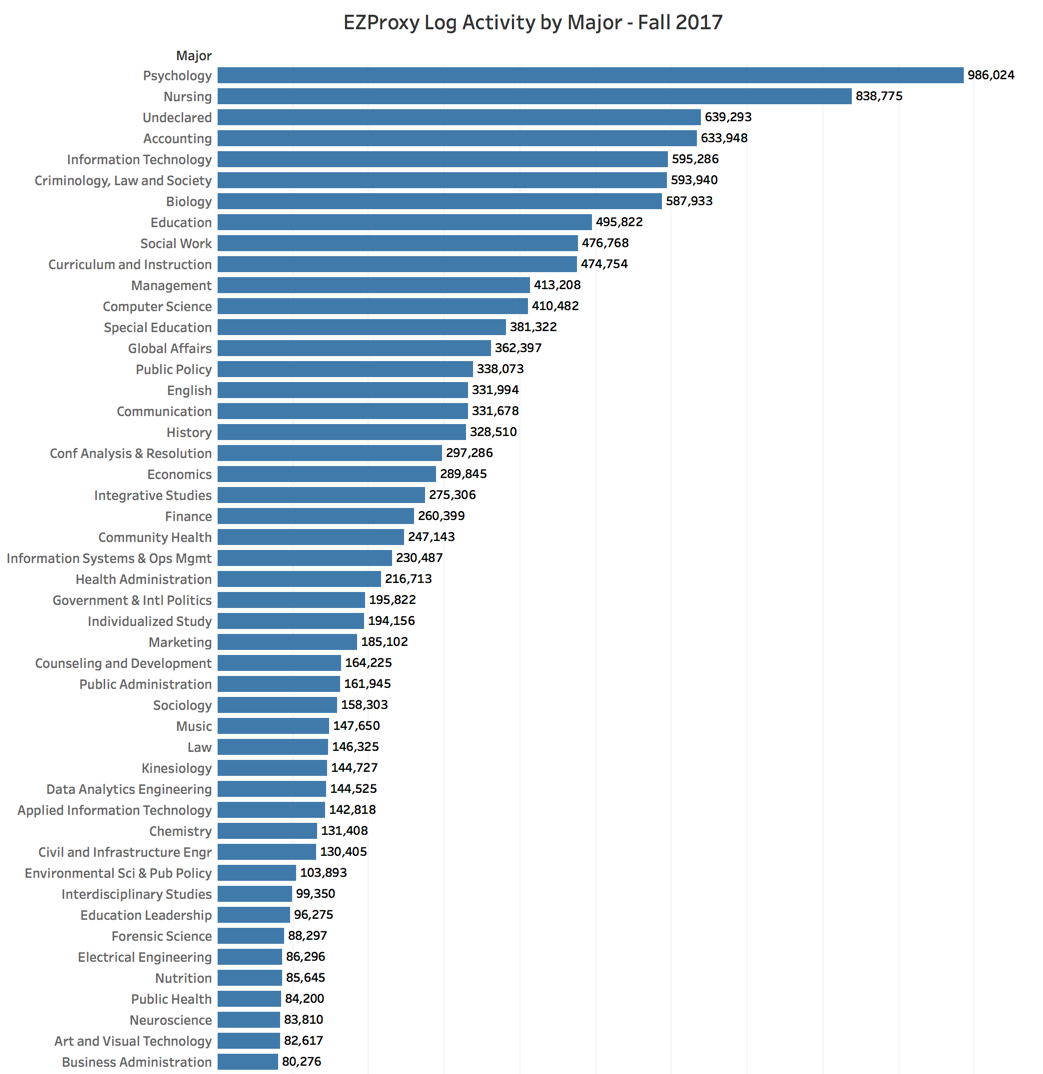
We have no perfect way of assessing e-content usage by our students even though we’re now spending 75% or more of our collections budget on this sort of material. We do receive and analyze COUNTER statistics but COUNTER stats focus on what’s being used and collapse all activity by students, faculty and staff into a single number for each source. Fine as far as it goes, but I’m also interested in who’s using content. Not down to the individual (I value the library’s reputation for privacy) but at least to some meaningful though suitably-anonymous aggregation. Until I get a better tool, here’s how I go about answering a question like “how do the different majors use our e-content collections?”
The basic idea is this: each line of our proxy server’s log file contains the user’s netID, the time of the transaction and the link that was proxied. Another dataset I have access to–the student directory—includes both the netID and the declared major for each student. Joining these two datasets on the netID, I can get a count of e-content activity for each major.
This works but obviously it’s not a very precise tool. For example, I’m only analyzing traffic that goes through our proxy server (basically our off-campus users) and ignoring open-access e-content altogether (we don’t use our proxy server to provide access to those sorts of resources). Six thousand of our 34,000 students live on campus so I’m comfortable assuming that off-campus use is a reasonable proxy for all usage but I realize this is a very blunt instrument.
To explain the graph below, that 986,024 figure for Psychology majors means in the semester-long activity log file on the proxy server, there were 986,024 lines in the file that were generated by content coming through the server bound for a declared Psychology major.
The method I use to convert the proxy server log to an SQL database hasn’t changed much from the how-to I posted a few years ago. I did, however, make a small, simple and obvious refinement this year: before computing the per-major count, I eliminated lines from the log file that referenced things like javascript or css files and also tossed out glyph or icon entries. Doing so removed a bit of noise from my results since some databases have much more graphically-rich interfaces and all those widgets, icons and glyphs skew my count. Here’s a graphic representation of the top 50 or so e-content using majors:
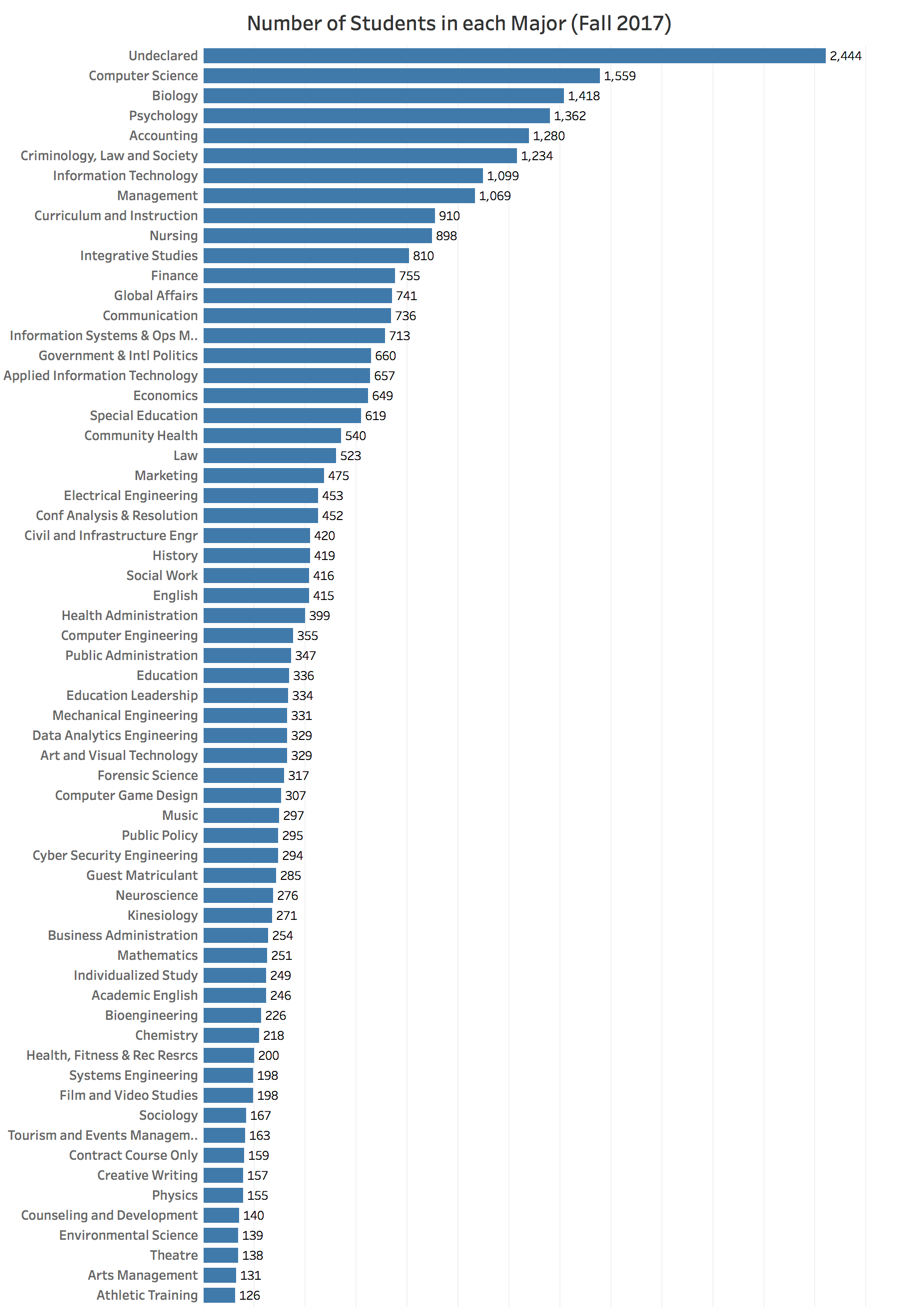
This next chart shows the number of students in each major. Comparing this graph with the first one, you can see that some majors generate far higher levels of use than their numbers might indicate (e.g., Public Policy ranks 40th in the number of students majors but 15th in e-content usage).