wget -> WARC

      Comments Off on wget -> WARC

Had an email exchange yesterday with a group that wants to archive a few of their online web projects in our MARS system. Due to what I hope is a temporary vacancy in our staffing, that meant I had to take the lead in explaining how we handle archiving a website and what the end result of that process looks like.

I had a solid understanding of the what we do part–it’s pretty straightforward: we point a webcrawler at the up-and-running version of the site and pack what we get back into a WARC file. We then upload that WARC file to the DSpace instance that delivers our MARS service and flesh out the metadata. We’ve done a number of these and it works well. My immediate challenge was mastering the how do we do this.

Until recently, the actual work of producing and archiving the WARC file was handled by Jeri Wieringa (who recently moved on from her still-spoken-of-in-reverent-tones stint with our Mason Publishing Group to new challenges). As I started down the WARC-enlightenment path, I was glad to see that our MARS entries for archived sites point the user to WARC-viewing tools for both Windows and MacOS. Seems we recommend Ilya Kreymer’s webarchiveplayer available at https://github.com/ikreymer/webarchiveplayer. So I started there…downloaded and installed the Mac version, pointed it at one of our archived WARC files and in minutes had a pretty firm grasp of this end of the process.

What I still didn’t know was precisely how we had been producing these WARC files. While on Ilya’s GitHub repository for webarchiveplayer I noticed a link to webrecorder—which I later learned corresponds to the service deployed at https://webrecorder.io.   That looks like a large-scale solution and one I’ll set up and test soon. Until then, I’m going with a very lightweight method….wget.

This command from a unix shell or terminal window, produces a useable WARC of this blog:


wget --recursive --warc-file=inodeblog --execute robots=off --domains=inodeblog.com --user-agent=Mozilla http://inodeblog.com

Building the WARC across the net (wget was running on my office iMac at Mason and inodeblog.com lives at reclaim hosting), took roughly 7 minutes. If you’re going to sites you don’t own, you’ll probably want to add a –wait=X switch to pause for ‘X‘ seconds between requests and add your email to your –user-agent= string so people know who to contact if they don’t want to be crawled.

If you wonder how a website looks after it’s been WARC-ed, grab a copy of webarchiveplayer and have a look at the 16 megabyte WARC file for this blog: inodeblog.warc.gz

You can decipher my “switches” and see many other possibilities at this wget documentation site: https://www.gnu.org/software/wget/manual/html_node/index.html#SEC_Contents

I’ll update this post with our “official” method for producing WARCs as soon as I either find a note where Jeri explained our process to me or learn enough to define and document a new standard for us.

* 2019 update:  This is the link you want to use for a WARC viewer:

https://github.com/webrecorder/webrecorderplayer-electron/releases/latest

A few Library-related RSS feeds

      Comments Off on A few Library-related RSS feeds

Not long ago I started using my RSS reader again.  As expected, my back-to-the-future fling with RSS found that many of my go-to feeds had shuttered in the intervening years, but happily many good ones were still around…

It didn’t take me long to rediscover that a decent news reader–and a good set of links–is a great and relatively painless way to stay current.  After a bit of pruning and with a few new additions, I thought it might be useful if I posted my current feed list.   It is a bit idiosyncratic–reflecting my interest in most aspects of digital librarianship.  If you have additions I should know about (and I hope there are many I’m missing), send me a link or better yet, an OPML file of your current feedlist.

send to: wallyg at gmu dot edu

My list as an OPML file is here.

Academic Librarian

ACRLog

Assessment on the Ground

Bibliographic Wilderness

Chicago Librarian

Data Pub Blog

Data Science ish (text mining, APIs, etc.)

Devil’s Tale (Duke U.)

dh+lib (Where the digital humanities and librarianship meet)

Digital Library Blog (Stanford)

Digital Preservation Matters (Chris Erickson)

Digital scholarship blog

Disruptive Library Technology Jester

Distant Librarian

Dueling Data (Data Visualization)

Feral Librarian

Go To Hellman

Hack Library School

Here and There

Impromptu Librarian

In the Library with the Lead Pipe

Information is Beautiful (Data Visualization)

Information Technology and Libraries

Inside Higher Ed | Blog U

iNode (George Mason University Digital Programs)

IO: In The Open

Archives and Special Collections – James Hardiman Library

Jaime Mears (Notes from a Nascent Archivist)

Joeyanne Libraryanne

KnowledgeSpeak.com

Krafty Librarian

Laurie Allen

Library & Technology Blog

Library Assessment

Library Juice

Library Lost & Found

Library Tech Talk (University of Michigan)

A Library Writer’s Blog

Lorcan Dempsey’s Weblog

Matthew Reidsma

Information Wants to Be Free – Meredith Farkas

Metadata Blog (ALA)

Miriam Posner’s Blog

Musings about Librarianship  (Aaron Tay)

No Shelf Required

OpenAIRE blog

Pattern Recognition (Jason Griffey)

Pinboard (Dorthea Salo) You can learn a lot stalking the right bookmarker!

Planet Code4Lib This one aggregates a number of blogs

Preservation Underground (Duke U.)

ResearchBuzz

The Signal: Digital Preservation (Library of Congress)

TechSoup for Libraries – Blog

Temple University Digital Scholarship Center

Text Mining, Analytics & More

Thoughts from Carl Grant

Waki Librarian

about e-content usage…

      Comments Off on about e-content usage…

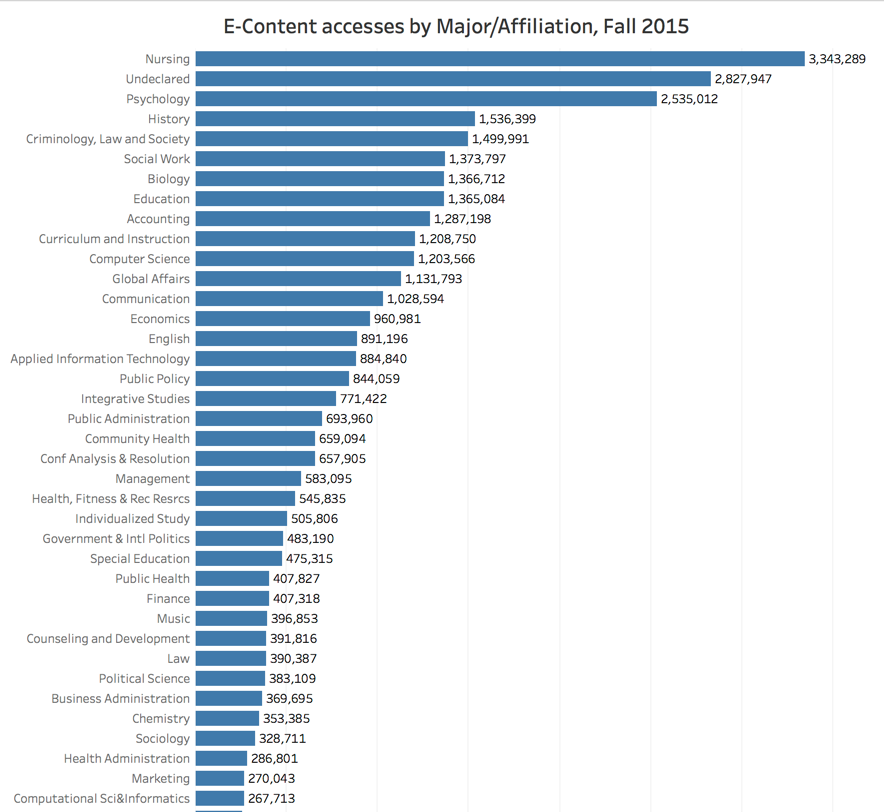
Was recently asked to help come up with data to help give the library a better handle on who is using our e-resources–to complement the numbers we have on what’s being used.  Hard to be precise given all the variables, but I did hit upon something I think serves as a reasonable proxy (no pun intended).

Step one was to pull together three different datasets:

  • an enormous (70+ million lines) proxy server log that covered all off-campus activity for restricted resources for the entire Fall 2015 semester.  This log has NetIDs for users.
  • our campus directory e-file which includes both a NetID (email address) and the major or departmental affiliation for students, faculty and staff
  • a spreadsheet  from a friend in Admissions which gave meaningful descriptions to the many four letter codes for majors we use here at Mason

The proxy server logs and campus directory were imported into MySQL tables (using the methodology I outlined a couple of years ago in a post about parsing EZProxy logs).  I then ran a simple SQL query:

select affiliation,count(*) from users
join proxy where proxy.username = users.username
group by users.affiliation
order by count(*),desc

Ended up with a result like this:

NURS 3343289
UNDE 2827947
PSYC 2535012
HIST 1536399
CLS 1499991
SOCW 1373797
BIOL 1366712
EDUC 1365084
ACCT 1287198
CRIN 1208750
CS 1203566
GLOA 1131793
COM 1028594
ECON 960981
ENGL 891196
AIT 884840
PUBP 844059

…and so on.

Exported the MySQL results to a CSV file and launched Tableau.  Within Tableau, I joined the results of my MySQL work with the CSV file containing “major codes” and their descriptions (so I could flesh out those NURS, GLOA, PUBP codes).  I hit one of Tableau’s “visualization” buttons.

Got a chart like the excerpt you see below.   Eventually, the complete visualization became an appendix in a document we prepared for internal reporting.  If you’re curious, you can download that final chart as a PDF.


For your textual pleasure…

      Comments Off on For your textual pleasure…

Earlier today I was running a few SQL queries against our local Voyager system–preparing for the upcoming metadata migration to a consortial implementation of Alma.  My tool of choice for this sort of thing is Navicat and as I worked through a series of “count this for me” queries, like…

  • how many bib records have NULL in the NETWORK_NUMBER field?   54,995
  • how many have an OCLC number in that field?  1,640,304
  • exactly how many bib records are there in the database?  3,490,929

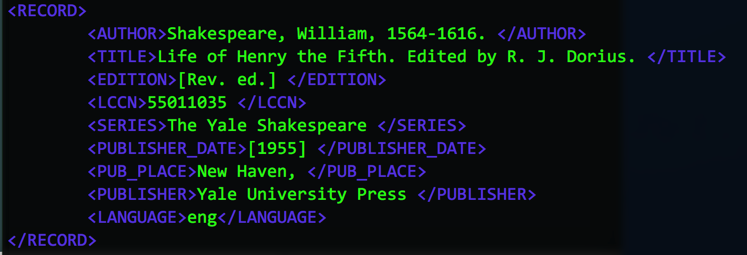
…I realized that Navicat made the export of data in a variety of formats a reasonably trivial exercise. Thinking it might be somehow useful for people sharpening their text-mining chops in our new Digital Scholarship Center (2nd floor, Fenwick Library), I decided to build a text file of brief bibliographic data (author, title, publisher, date, etc.) from the 3+ million records in our Voyager database. A simple click in a checkbox produced both JSON and XML versions of the metadata

The zipped versions of these files are roughly 200MB each.

Click the link below to retrieve the JSON recordset.

https://dl.dropboxusercontent.com/u/166896/MasonCatalog.json.zip
 

XML?  Click below…

https://dl.dropboxusercontent.com/u/166896/MasonCatalog.xml.zip
2017 03 09 10 31 53

Sample record in the JSON version of the file

The XML version has a couple more data fields (LCCN and SERIES) if available in a record.


If you end up using this data for anything useful (or need a slightly different extract), send me a tweet

arXiv usage at Mason

      Comments Off on arXiv usage at Mason

The other day we started talking about joining arXiv.org as a way to help support Open Access and the valuable service that arXiv offers.  As you’d expect, the question arose, “How often do we think it’s being used?”

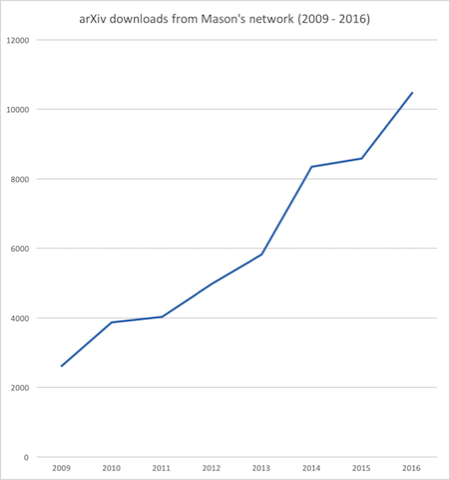
One exploratory email to support at arxiv.org and I had an answer almost within the hour.  For accesses from the gmu.edu domain (meaning the user was on the campus network) we see this activity:

Year    Downloads

2009   2,623

2010   3,867

2011   4,034

2012   4,975

2013   5,821

2014   8,351

2015   8,587

2016  10,480

A steady increase.  Graphed, it’s easy to see.   I’m going to guess that the jump in use around 2013 coincides with our rollout of the Primo discovery service (metadata for arXiv documents is included in the underlying database).

Arxiv gmu

When you consider that we also have users who visit arXiv from off-network devices, it’s an easy decision for us–we are joining arXiv.  Membership fee works out to about 14 cents per download (orders of magnitude better than what we see with Elsevier).

Consortial Borrowing

      Comments Off on Consortial Borrowing

University Libraries belongs to several cooperatives that provide our students, faculty and staff with enhanced access to materials beyond our local print and digital collections.  The big four for Mason are:

LocalWRLC (Washington Research Library Consortium)

StatewideVIVA (Virtual Library of Virginia)

RegionalASERL (Association of Southeastern Research Libraries)

National CRL (Center for Research Libraries)

A Mason reader can request an item held in the collection of any library affiliated with one of these cooperatives and its delivery will be expedited thanks to something rather akin to the “favored nation” status that exists between members of each collective.

As you might guess, thanks to ease of networked discovery and physical resource proximity, researchers at Mason borrow a fair amount of material from fellow member institutions in the WRLC.   What might surprise you is that Mason is a net lender to our fellow WRLC institutions (e.g., they borrow more from us than we borrow from them) and we have a similar status with the ASERL membership as well.  I view this as marker of the strength and currency of Mason’s collections…though I know the danger of basing an argument  on data viewed in isolation (e.g., a contrarian might argue that the collections of others are equally strong and also heavily used and we’re just racking up lending numbers as the backup source for that 2nd or 3rd copy of something).  “Data-informed” is safer than “data-driven.”

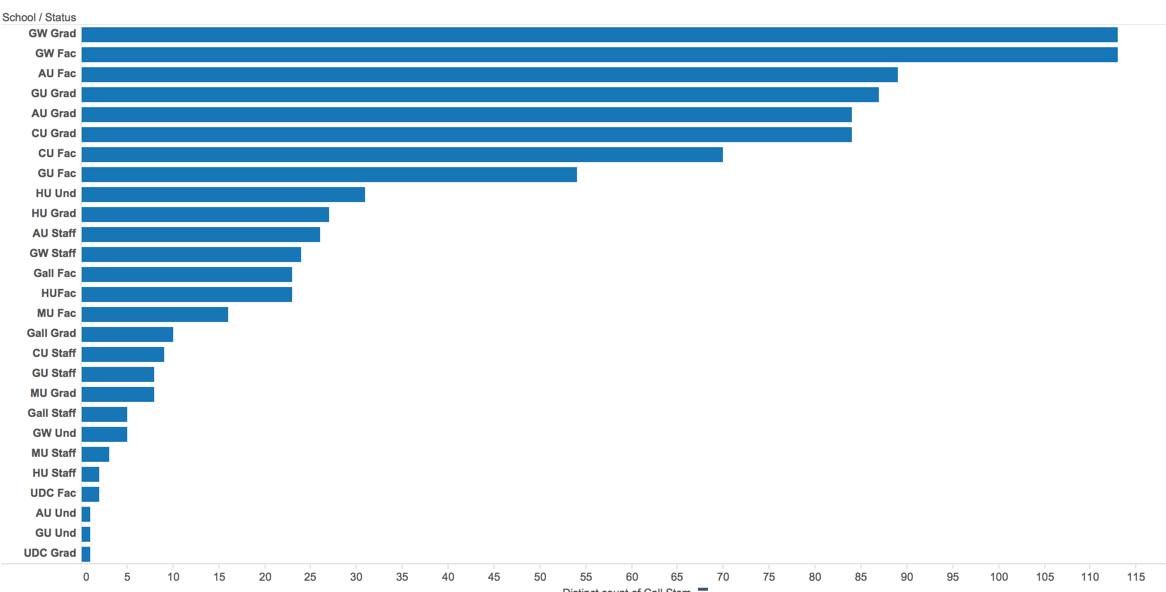
Wondering how that activity is distributed across potential users and our collections, I decided to generate a “snapshot” dataset of every item currently checked-out to an affiliate of WRLC.  Then I graphed the level of ‘borrowing-from-Mason’ activity by staff, undergraduate, graduate and faculty users at each member library (click to enlarge the graphic):

Wrlc Borrowing

WRLC Borrowing from Mason by School and Borrower Status

Graduate students at George Washington are our most active borrowers (with 115 items in circulation).  Seems odd but GW faculty are tied with an identical 115 items charged at the moment.  As you move down the left column, you find AU faculty coming in third with 89 items, followed by Georgetown graduate students at 87, and so on down the list.

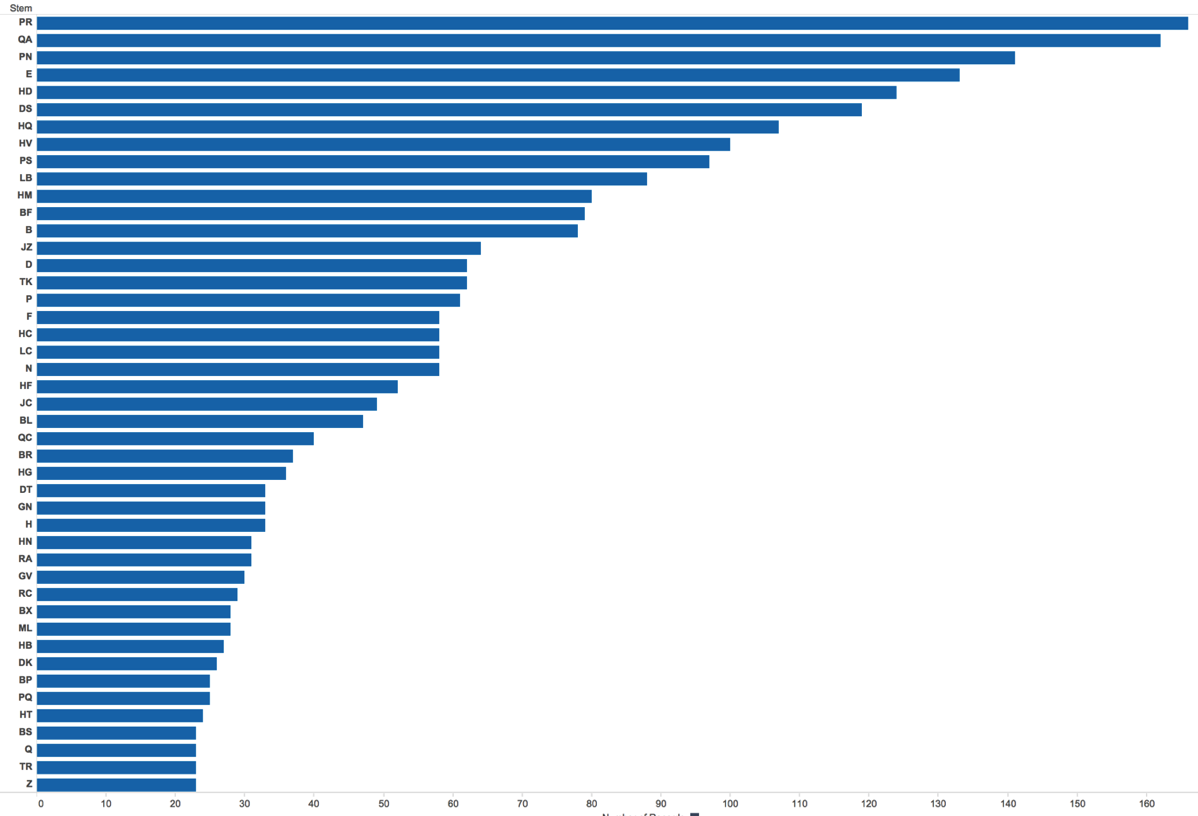
What sections of our library collection most interest WRLC borrowers?  The next graph shows by Call Number stem just how many items are currently in circulation to various WRLC borrowers.   The PR classification (English Literature) leads the list with 160+ items. QA (Mathematics…but you’ll find most of the computer books carry a QA classification as well) comes in a close second.  Love the fact that Z (Library Science and Bibliography) trails the list  🙂

WRLC borrowing by LC Class

What Mason Lends WRLC members by LC Classification

A few Primo numbers…

      Comments Off on A few Primo numbers…

2016 04 05 12 02 38

A few observations based on 12 months of data from our Primo discovery system (Jan 2015 ~ Dec 2015):

Sessions:

  •  333,091 unique sessions
  •  Roughly 2% originated outside the U.S.
  • Users signed in 5382 times (roughly 1.5% of sessions)

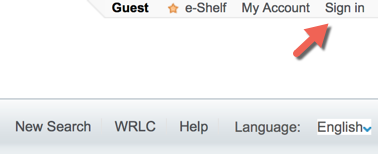
Great to see there were 333K sessions during the year but the fact that fewer than 2% of our users ever sign in is particularly worrisome for a library that serves a geographically-dispersed community. A number of our content providers require that their material be excluded from discovery and delivery if you can’t show that you have a Mason affiliation. Working from a device on the campus network meets that test for most of these vendors but a signon with our Primo satisfies them all.

So, whether you’re studying in a local coffeeshop before your evening class, or you are a Mason Online student hundreds of miles from campus, to search Primo for content from ARTstor, MLA International Bibliography,  Web of Science and several other resources  you’ll have to sign in.

2016-04-05_12-28-54

Worth mentioning a few other benefits that signing-on delivers:

– tweak the relevance of Primo’s retrieval–ranking materials in your area of interest more highly

– store items on your personal e-shelf between Primo sessions

– increase the number of results per page (up to 50)

– access your circulation record

– set up recurring queries

– build RSS feeds of result sets

…and more

Searches:

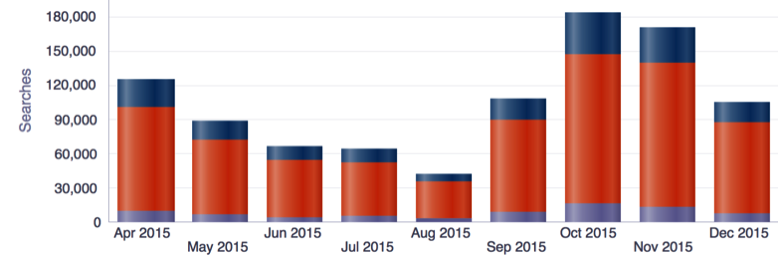
  • 1.1 million searches were performed
  • 999,731 of those were basic searches (90.3%)
  • 106,314 were advanced searches

Laptop borrowing…

      Comments Off on Laptop borrowing…

A few months ago we placed a 12 unit laptop self-checkout kiosk in one of our libraries.  It is certainly being used though not as much as I had originally expected.  Possible reasons:

  • it’s a new service so it takes time to be discovered and incorporated into a student’s routine.
  • maybe we haven’t yet found the sweet spot on circulation parameters so demand is affected (we offer 3 hour loans and a $5 per hour overdue fine (max $120))
  • perhaps most students bring a device to the library when they know they’re going to do computer-assisted research
  • quite possibly it’s something else altogether

Ignoring checkouts by library staff, we had 857 circulations of a laptop over the past 53 days (since 02/01/2016).  Averaging the activity across that time period comes to 16 laptop loans each day.  If we also toss out loans of less then 10 minutes, the number drops to 842 circulations or roughly 15 per day.

Given the hours the library’s open and the inherent downtime required for laptop recharging, we can guesstimate the average availability for each of the twelve laptops at something like four (4) borrow/return cycles per day.  It follows then that a 12 unit kiosk could support perhaps 2500 charges during a 53 day period.    Using those parameters, we’re utilizing roughly 33% of the system today.   That seems OK for a newly minted service and I’ll be interested to see how the numbers track up or down in coming months.

Later (and mostly because I’m looking for things to graph as I study Tableau),  I decided to dig a bit deeper.

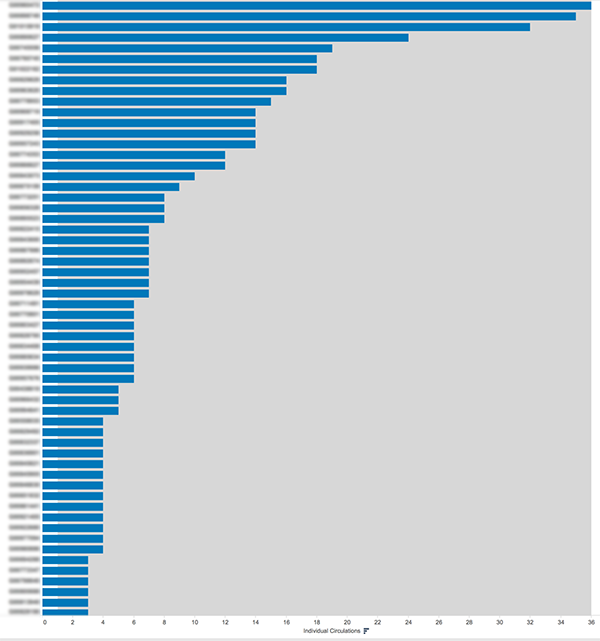
In the visualization below, each line is a particular borrower (identifying information blurred out).  The blue line grows with each circulation by that same borrower.  To sense the scale, that user on top line checked out a laptop 36 times during the 53 day period.

laptopborrowing

Pareto would be pleased.  As the graphic demonstrates, a very few users are making heavy use of the system, others not nearly as much.    During this 53 day period, a bit less than a third of our usage (242 circulations) was racked up by just 14 users (5.01% of the total borrower population).

Finally, I decided to join the kiosk statistics with some information in our Voyager system.  The result is a visualization that highlights the academic status of our borrowers.  Each green bubble is an undergraduate borrower, the size of the bubble scaled to the number of times that person borrowed a laptop during the test period.  The orange bubbles are graduate students.   Thus far, the data suggests that borrowing a laptop from a kiosk is mostly something undergraduates do.


borrowerstatus


And what major made heaviest use?  Biology majors accounted for 17% of all laptop circulations.  2nd place? Undecided/Undeclared at 11%.

What’s In Circulation Today?

      Comments Off on What’s In Circulation Today?

Starting a teach-myself-Tableau session today so I thought I’d extract some data from our ILS to keep things interesting and relevant.   Here’s a graphic showing what physical items (not e-books) are in circulation to Mason students, faculty and stafff on March 21, 2016, sorted by LC classification stem.

So, for example, we have 1,207 items with a QA classification (Mathematics, Computer Science) in circulation at the moment and 489 from the DS classification (History of Asia).

Circ snapshot

Yes, I too noticed it has been two years since my last post…

Primo usage data tidbits…

      Comments Off on Primo usage data tidbits…

1.4 million

That’s the number of searches conducted on our Primo system between March 17, 2013 and March 17, 2014.

Roughly three weeks ago, I added Google Analytics code to our site and already it’s producing some interesting information (even if one of those weeks was Spring Break).  For example, seems we have a bit more global reach than I expected:


2014 03 18 09 25 39


Originating country for traffic we received over the past 20 days (13,848 visits, 7,400 different visitors).  Worth noting, of course, is that  99.5% of this traffic originated in the United States.

What browser were those 13,848 sessions using?

  • Chrome 41%
  • Firefox 25%
  • Safari  17%
  • IE 15%
  • all others less than 1%

Across all computer users, Macs have about a 13% market share.  That’s not what I see when I walk around the library so this isn’t too surprising:

  • Windows  65%
  • Mac 30%
  • iOS 3%
  • Android 1%